Figure 7.

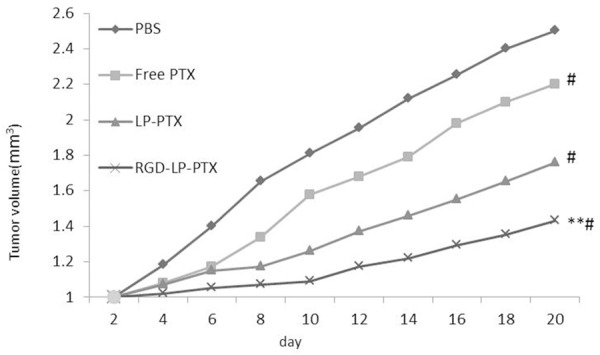
In vivo anti-tumor effect of different PTX formulations in PC-3 bearing mice compare to PBS group, #P < 0.01; compare to free PTX group and LP-PTX group, **P < 0.01.

In vivo anti-tumor effect of different PTX formulations in PC-3 bearing mice compare to PBS group, #P < 0.01; compare to free PTX group and LP-PTX group, **P < 0.01.