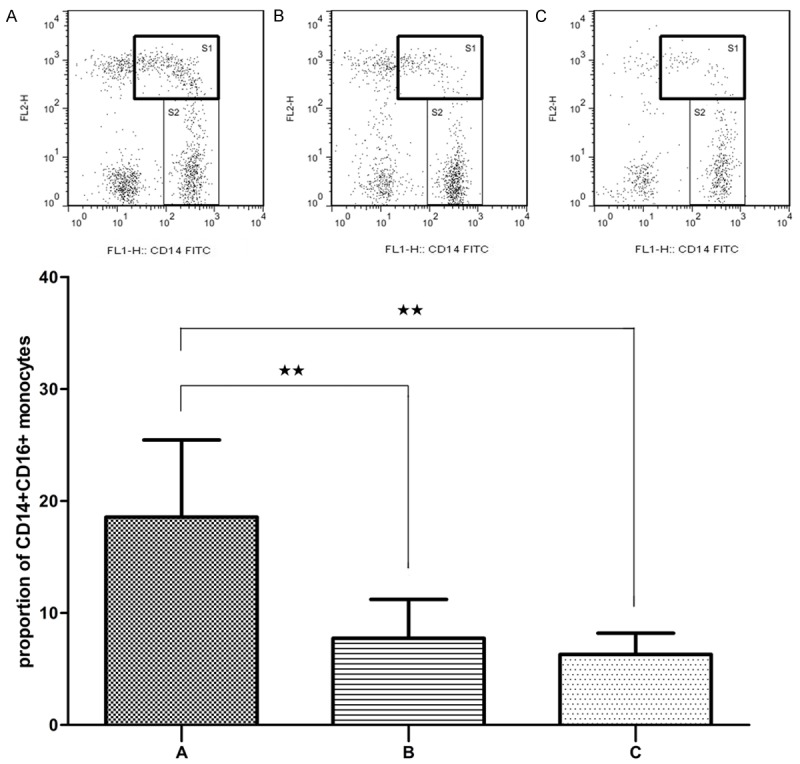
Figure 3.

Flow cytometry analysis of CD14+CD16+ monocytes (S1) expression in AL patients in period of onset (A), patients in remission (B) and normal controls (C). Data are presented as the mean proportion of CD14+CD16+ monocytes with standard deviation. *P < 0.05, **P < 0.01.
