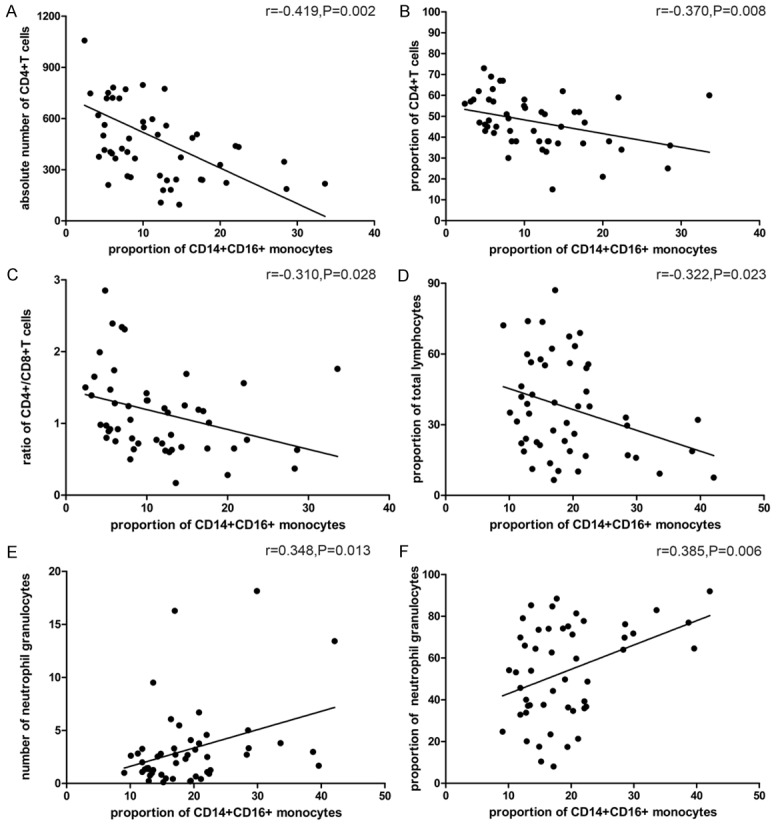
Figure 6.

Correlation between the proportion of CD14+CD16+ monocytes and absolute number of CD4+ T cells (A), the proportion of CD4+ T cells (B), the ratio of CD4+/CD8+ T cells (C), the proportion of total lymphocytes (D), number of neutrophil granulocytes (E) and the proportion of neutrophil granulocytes (F).
