
Figure 3.
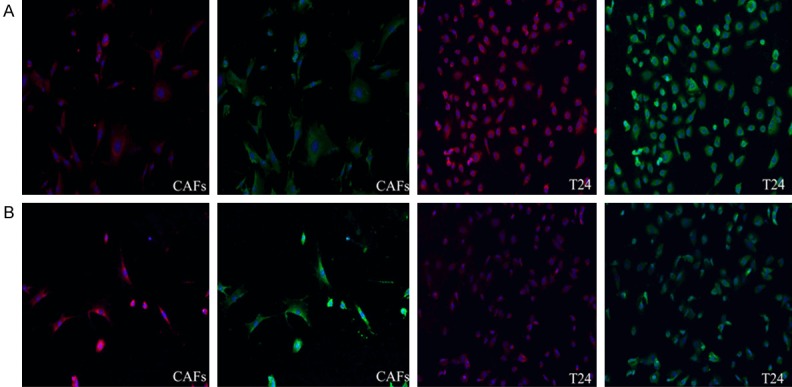
Immunofluorescence results for the different groups (100X magnification). The green images were obtained with an anti-mitochondria antibody, and the red images were obtained with MitoTracker Red. Line A represents the experimental groups, and line B represents the control groups.