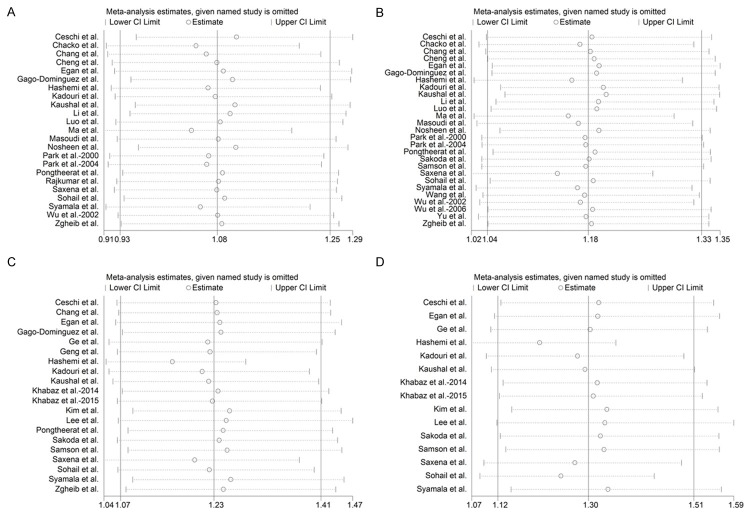
Figure 4.
Sensitivity analysis of the summary odds ratio coefficients on the relationships between GST polymorphisms and breast cancer risk. Results were computed by omitting each study in turn. The two ends of the dotted lines represent the 95% CI. A. GSTT1 polymorphism. B. GSTM1 polymorphism. C. GSTP1 polymorphism under dominant model (GG+AG vs AA), D GSTP1 polymorphism under allelic model (G vs A).

