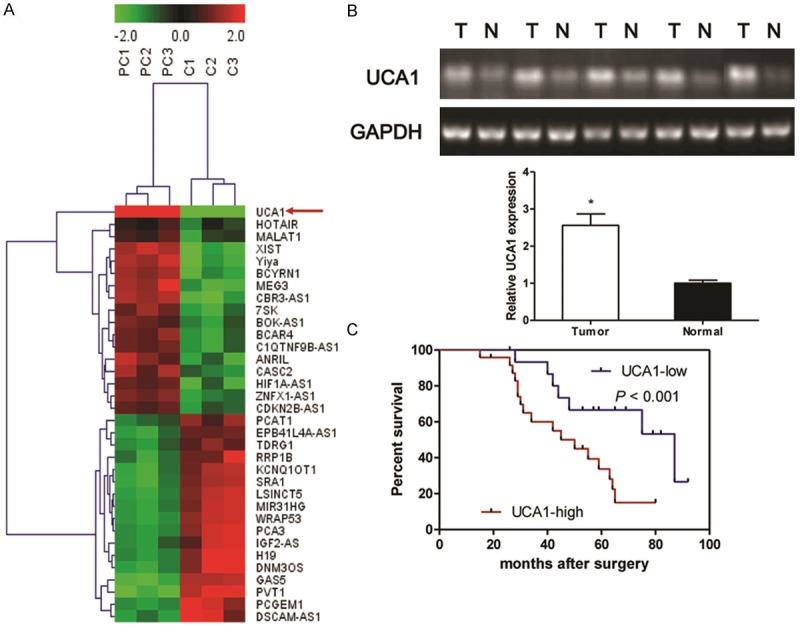
Figure 1.

Identification of tumor tissues-enriched lncRNA implicated in PC patients. Microarray and hierarchical cluster analysis of the differentially expressed long non-coding RNAs (lncRNA) in tumor tissues from PC patients and corresponding nontumourous tissues. The figure is drawn by MeV software (version 4.2.6). Differentially expressed lncRNAs chosen from lncRNA and disease database. Correlation similarity matrix and average linkage algorithms are used in the cluster analysis. Each row represents an individual lncRNA, and each column represents a sample. The dendrogram at the left side and the top displays similarity of expression among lncRNAs and samples individually. The color legend at the top represents the level of RNA expression, with red indicating high expression levels and green indicating low expression levels (A). Semi-quantitative reverse transcription polymerase chain reaction (RT-PCR) is used to detect the expression of UCA1 in the tumor tissues and corresponding non-tumourous specimens from PC patients (B). Kaplan-Meier survival curve and log-rank test are used to evaluate whether UCA1 expression level is associated with 5-years overall survival rate. Patients were segregated into UCA1-high group and UCA1-low according to the median of UCA1 expression in tumor tissues (C). Values are expressed as mean ± SD, *P < 0.05 versus non-tumourous group.
