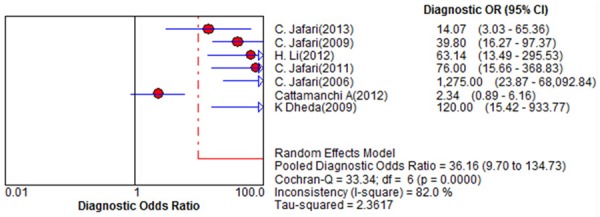
Figure 3.

Forest plot of estimates of diagnostic odds ratio for BAL-ELISPOT in the diagnosis of smear-negative tuberculosis. Point estimates from each of the studies are shown as solid circles, the sizes of which reflect the size of the study. Error bars show 95% confidence intervals. Reference numbers of cited studies are given.
