
Figure 4.
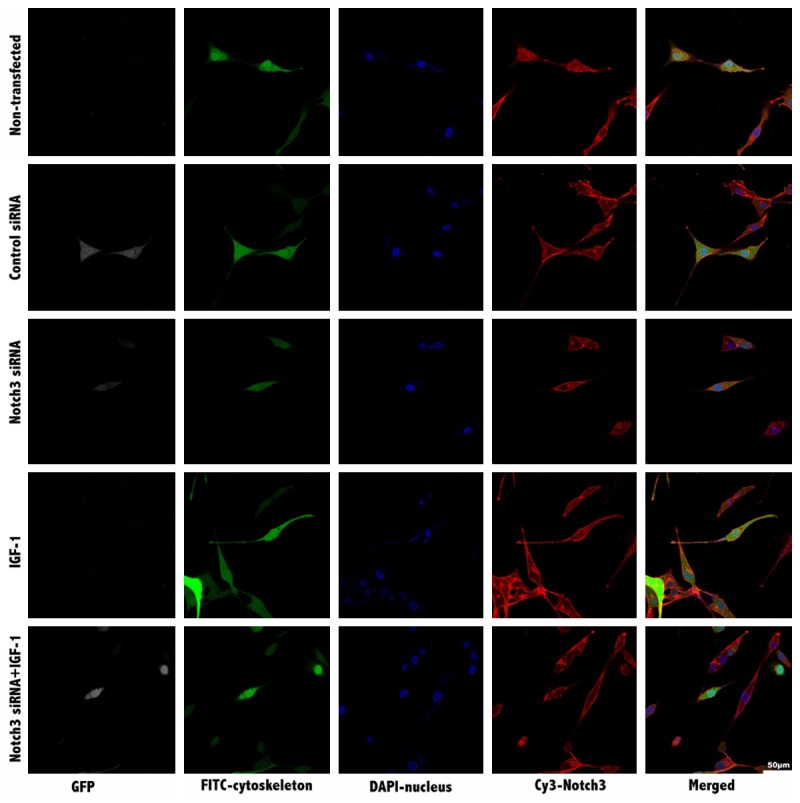
Morphology and structure analysis of VSMCs using confocal microscopy. GFP was shown in grey, FITC-labeled cytoskeleton was shown in green, Notch3 expression was staining in red. Nuclei were stained with DAPI in blue. Merged images at the same site are shown at the very right column. The scale bar equals 50 µm.