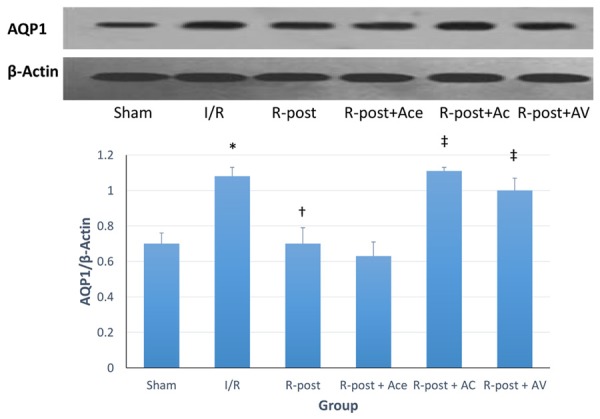
Figure 3.

Western blot analysis. Expression of AQP1 was characterized using densitometry of western blot analysis. The expression of AQP1 was compared to β-actin and presented as AQP1/β-actin ratio. *Compared to sham group, P<0.05. †Compared to I/R group, P<0.05. ‡Compared to R-post group, P<0.05.
