
Figure 6.
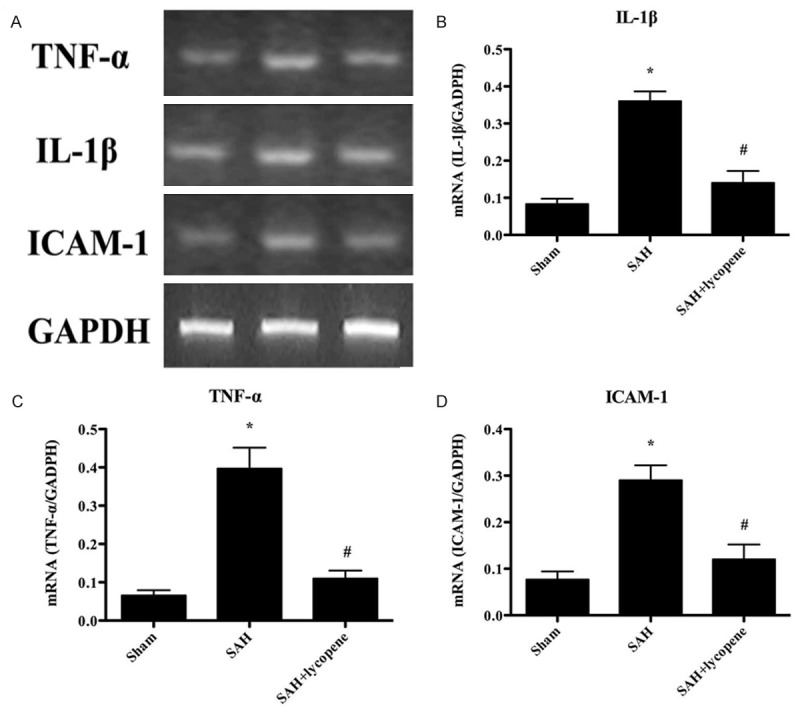
The gene expressions of TNF-α, IL-1β, and ICAM-1 in the brain detected by RT-PCR. A. The representative autoradiograms of TNF-α, IL-1β, and ICAM-1. B-D. Relative amount of TNF-α, IL-1β, and ICAM-1 mRNA. The levels of TNF-α, IL-1β, and ICAM-1 increased dramatically in the SAH group. After lycopene administration, the levels of TNF-α, IL-1β, and ICAM-1 were decreased. Data were expressed as mean ± SD (n = 6 in each group). *P < 0.05 versus thesham group, #P < 0.05 versus the SAH group.