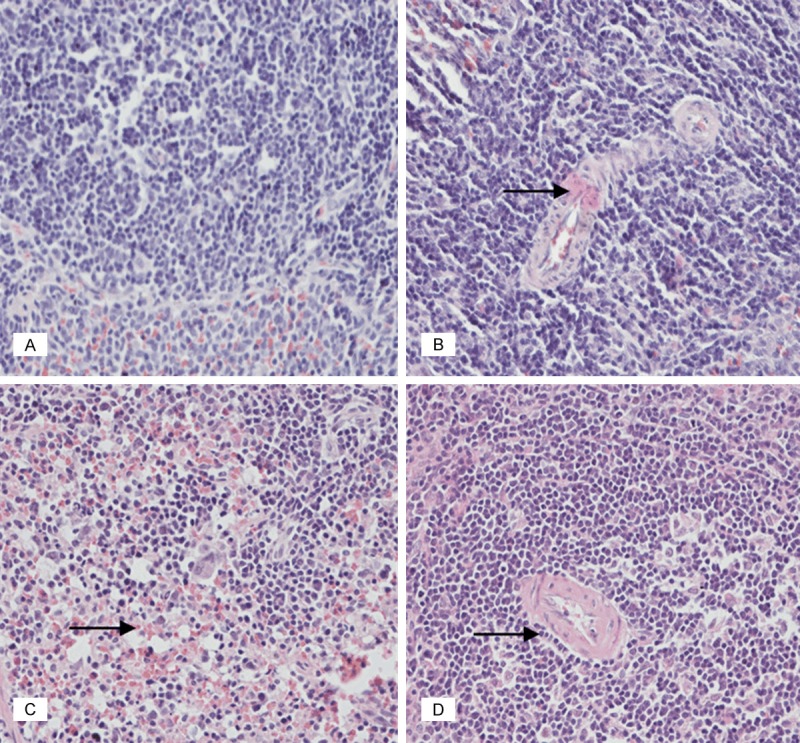
Figure 4.

According to the (A) saline control group of spleen, there was normal lymph node structure, macrolymphocyte and small lymphocyte. (B) Low-dose group of spleen. (C) Medium-dose group of spleen. (D) High-dose group of the spleen had normal lymph node structure, and with the increase of drug concentration, there were more Langerhans cells (black rightward arrow). (HE, 400×).
