Figure 1.

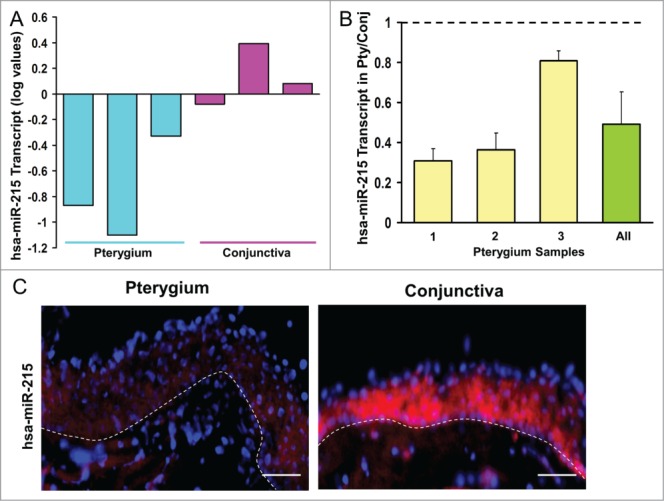
(A) Bar chart showing results of the Exiqon microRNA Array. Height of the bars shows the mean normalized log values of miR-215 levels in conjunctiva and pterygium tissues from different patients. (B) Bar chart showing individual and overall results from qRT-PCR assay performed on 3 separate pairs of human pterygium and conjunctival tissues. Height of the bars represents the relative fold change of miR-215 levels in pterygium with respect to conjunctival control. Error bars represent standard error of mean. Values are normalized to the 5S rRNA control values. (C) miR-215 in situ staining of human pterygium and conjunctival tissues. Diagram on the right showing conjunctival epithelium and some stroma. Pterygium and conjunctival sections hybridized with DIG-labeled miR-215 LNA probes (red). DNA was counterstained with DAPI (blue). Scale bar represents 100 μm. Dashed lines represent position of basement membrane separating epithelium from stroma.
