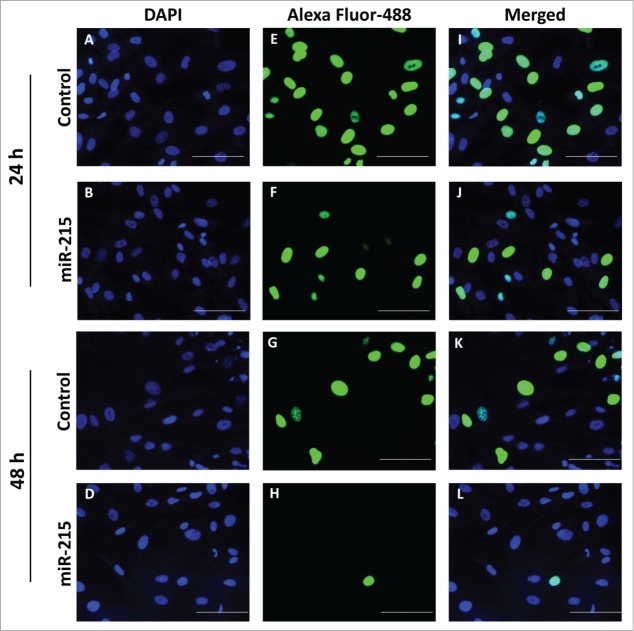
Figure 3.
Cell proliferation was analyzed using the Click-it EdU Alexa Fluor 488 (Life Technologies, Carlsbad, CA, USA) assay according to the manufacturer′s protocol. Pterygium fibroblast cells reverse-transfected with miR-215 mimic or non-specific oligonucleotide control and 10 uM of 5-ethynyl-2′-deoxyuridine (EdU) added and incubated for 10 h. (I), Cells transfected with miR-215 for 24 h, (J) cells transfected with control for 24 h, (K), cells transfected with miR-215 for 48 h, (L), cells transfected with control for 48 h; (E), (F), (G), (H), DAPI fluorescence only, for the same cells in (I)-(L), respectively; (A), (B), (C), (D), Alexa-Fluor 488 fluorescence only. Images shown are representative of 3 experiments. Scale bar represents 100 uM.

