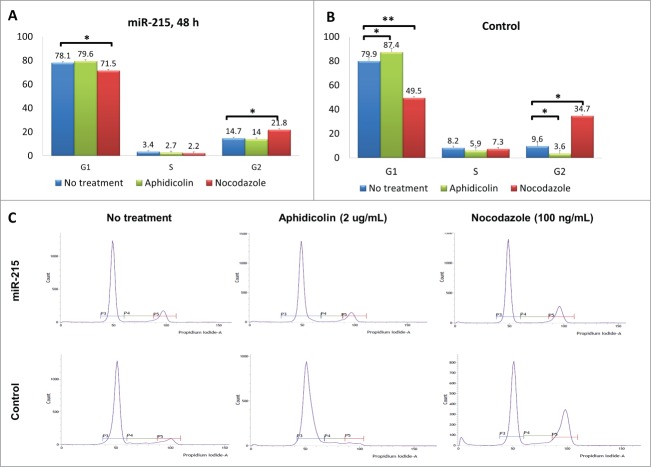
Figure 4.
Results of the cell cycle analysis: Cultured primary pterygium fibroblast cells were reverse-transfected with 100 nM miR-215 mimic or non-specific control oligonucleotide for 48 h, and arrested at G1 and G2 phases by blocking with 2 ug/mL aphidicolin or 100 ng/mL nocodazole respectively. Eighteen hours after drug treatment, cells were collected for cell cycle analysis using flow cytometry. (A and B) Cluster bar chart showing percentage of cells arrested at G1, S and G2, for miR-215 (A) or random oligonucleotide control (B) transfected cells treated with aphidicolin (green), or nocodazole (red). Non-treated controls are shown in blue. Numbers represent mean of 3 experiments ± standard deviation C. Histograms illustrate proportions of cells observed at different phases: the first peak corresponds to G1 and second peak G2. The histogram is extracted from one representative experiment from a series of 3 biological replicates.

