
Figure 5.
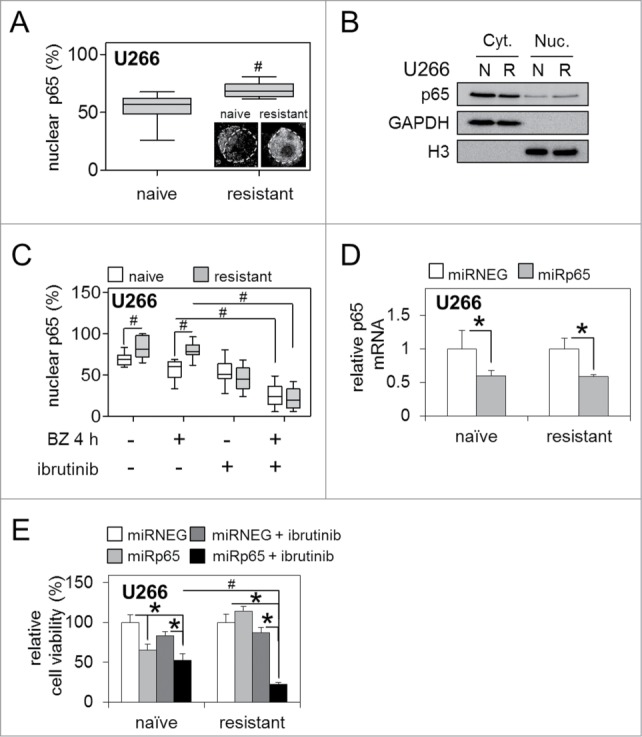
Bortezomib-resistance is driven by enhanced NF-κB p65 activity and can be reversed by BTK inhibition. (A) Quantification of staining intensity of nuclear p65/total NF-κB p65 (%) in bortezomib-naïve and bortezomib-resistant U266 MM cells. Box and whisker indicates the mean ± SEM (n ≥ 20). Statistical significance between cohorts was calculated by ANOVA; # indicates P ≤ 0.01. Inset shows example immunocytochemistry for NF-κB p65. Dotted line indicates nucleus as determined by DAPI staining. (B) Western immunoblot of bortezomib-naïve [N] and bortezomib-resistant [R] U266 nuclear [Nuc.] and cytoplasmic [Cyt.] cell fractions. GAPDH and Histone 3 [H3] show equal loading for cyt. and nuc. fractions, respectively. (C) Quantification of staining intensity of nuclear NF-κB p65/total NF-κB p65 (%) in bortezomib-naïve and bortezomib-resistant U266 MM cells. Box and whisker indicates the mean ± SEM (n ≥ 20). Statistical significance between cohorts was calculated by ANOVA; # indicates p ≤ 0.05. (D) qRT-PCR analysis of basal NF-κB p65 mRNA expression in bortezomib-naïve and bortezomib-resistant MM U266 cells infected with lenti-viral miRNA constructs targeting NF-κB p65 (miRp65) transcription relative to GAPDH. (E) Relative cell viability of bortezomib-naïve and bortezomib-resistant MM U266 cells infected with lenti-viral miRp65 24 h before and after ibrutinib 'pulse' treatment. Values indicate the mean ± SEM from 3 independent experiments. Statistical significance between treatments was calculated by Student's t test; * indicates P ≤ 0.05. Statistical significance between cohorts was calculated by ANOVA; # indicates P ≤ 0.01.