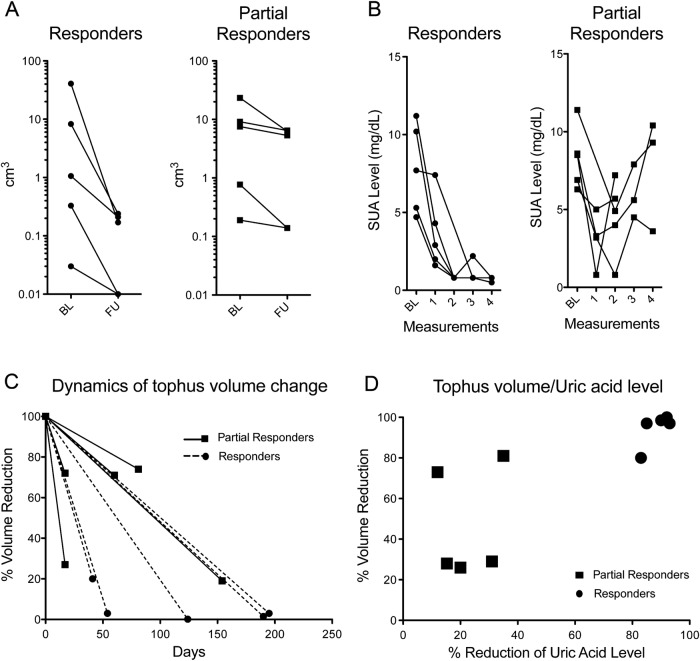
Figure 1.
Changes in tophus volumes after pegloticase treatment. (A) Changes of dual-energy CT (DECT)-based tophus volumes (cm3) from each individual patient at baseline (BL) before treatment and at follow-up after treatment. Patients were divided into two groups: responders (circles) and partial responders (squares) based on serum uric acid (SUA) response. Note the logarithmic scales. (B) SUA levels at BL and after the first four infusions with pegloticase. Two patients in the partial responder's group only received two infusions, hence only two SUA levels are demonstrated in the graph. (C) Dynamics of tophus volume reduction in responders (circles, dashed lines) and partial responders (squares, solid lines) dependent on the duration of pegloticase exposure. (D) Relation between tophus volume reduction (in %) and SUA level reduction (in %) in responders (circles) and partial responders (squares).

