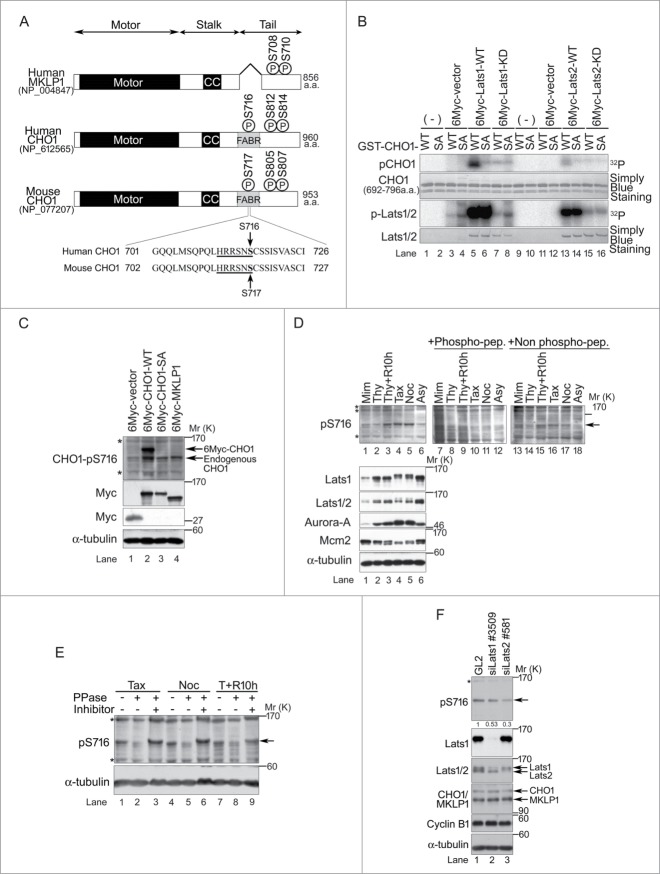
Figure 1.
(See previous page). Large tumor suppressors (Lats)1/2 phosphorylate CHO1-S716S717 during mitosis. (A) The primary structures of human and mouse CHO1 and human MKLP1. CC, coiled-coil domain. The Lats1/2 consensus sequences and phosphorylation sites are underlined and bold, respectively. (B) In vitro assays performed in the presence of [γ-32P] ATP using vector alone (control) or immunoprecipitated wild-type (WT) or kinase dead (KD) 6Myc-tagged Lats1 or Lats2, along with the expression of 3Flag-tagged Mob1A as a Lats1/2 activator. GST-fused truncated fragments (amino acids 692–796) of WT and S717A (SA) mutated MmCHO1-WT were used as substrates. (C) Immunoblot analyses of HeLa-S3 cells transfected with 6Myc-tagged vector alone, full-length MKLP1, or WT or S717A (SA) mutant MmCHO1. The cells were synchronized at the M phase by treatment with nocodazole. Asterisks indicate non-specific bands. (D) Immunoblot analyses of HeLa-S3 cells treated with mimosine (Mim), thymidine (Thy), taxol (Tax), nocodazole (Noc), or a thymidine single block-and-release (Thy+R10h). Control cells were asynchronous (Asy). The arrow indicates endogenous CHO1-pS716S717. For peptide competition assays, the anti-pS716S717 antibody was pre-incubated with phosphorylated (lanes 7–12) or non-phosphorylated (lanes 13–18) CHO1 antigen peptides. Asterisks indicate non-specific bands. Mcm2 is a marker of the G1 and S phases, whereas Aurora-A is a marker of the M phase. (E) Protein phosphatase (PPase) assay showing immunoblot analyses of endogenous CHO1-pS716S717 in HeLa-S3 cells synchronized with Tax, Noc, or Thy+R10h. The cell extracts were treated with or without 200 U of λPPase and PPase inhibitors. (F) Immunoblot analyses of HeLa-S3 cells transfected with siRNAs against Lats1 (#3509) or Lats2 (#581), and synchronized at mitosis by a thymidine single block-and-release (10 h). A GL2 (siRNA against firefly luciferase) was used as a negative control. The ratios of the band intensities of CHO1-pS716S717 to that in GL2 cells are shown.

