
Figure 3.
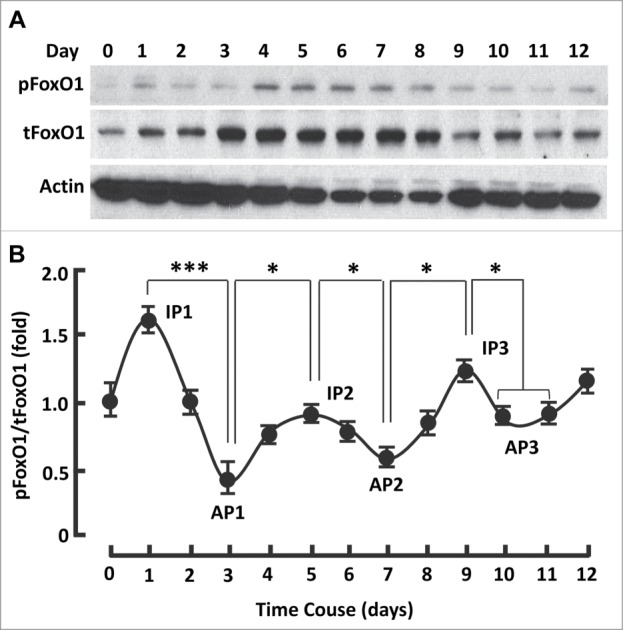
The kinetics of FoxO1 activation followed a series of sigmoid curves during adipogenesis. (A) Western blots showing FoxO1 expression (i.e., tFoxO1), activation (i.e., dephosphorylation) and inactivation (i.e., phosphorylation) during adipogenesis. β-actin was probed as the loading control. (B) Densitometric analysis of protein gel blot images with NIH ImageJ software; n = 3−5. AP, activation peak; IP, inactivation peak. * P < 0 .05; and ***, P < 0 .0001.