Figure 4.

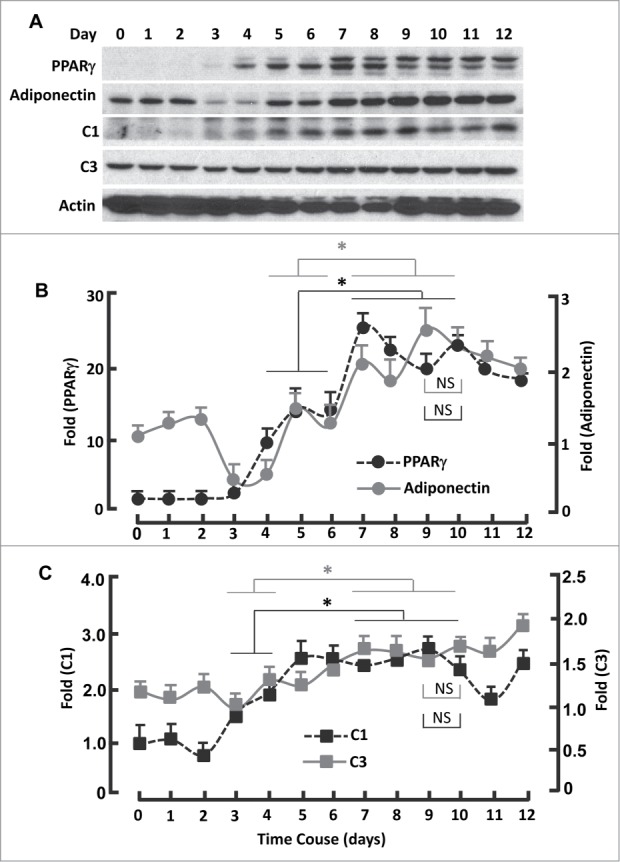
Kinetics of FoxO1-regulated protein expression during adipogenesis. (A) Western blots showing the expression of PPARγ, adiponectin, mitochondrial proteins C1 and C3. β-actin was probed as the loading control. (B) Densitometric analysis of western blot images for PPARγ and adiponectin with NIH ImageJ software. (C) Densitometric analysis of protein gel blot images for C1 and C3 with NIH ImageJ software. n = 3−5. * P < 0 .05; NS, not significant.
