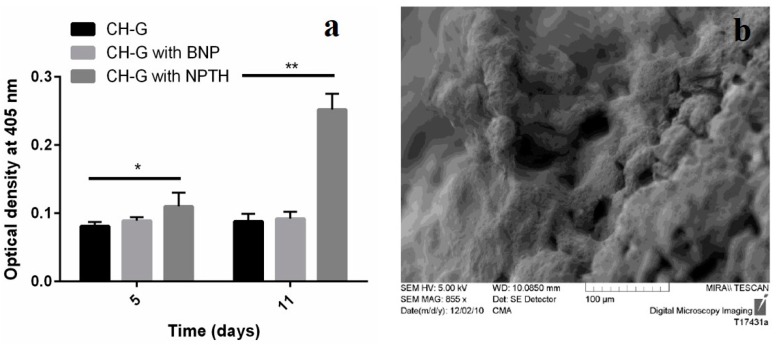
Figure 12.
(a) ALP levels expressed on scaffolds; (b) SEM image representing bio-mineralization on NPTH engrafted scaffolds 11 days of post cell seeding. Statistical comparison by Kruskal-Wallis One Way Analysis of Variance on Ranks showed significant difference at p < 0.05 (*) and very significant different p < 0.0001 (**).

