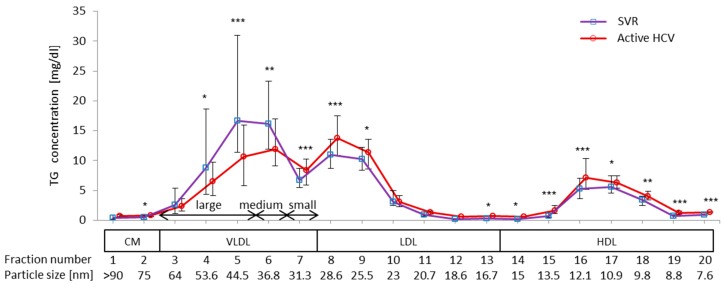
Figure 1.
Comparison of triglyceride (TG) concentrations in lipoprotein sub-fractions between active HCV and SVR groups. Serum lipoprotein was fractionated by HPLC into 20 fractions according to the particle size, and the concentration of TG in each fraction was measured using an online detection system (Skylight Biotech, Inc., Akita, Japan). The fraction number and the mean particle size are shown at the bottom of the image (* p < 0.05; ** p < 0.01; *** p < 0.001).

