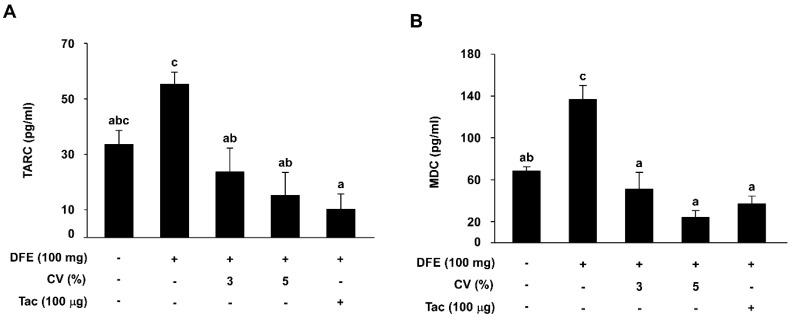
Figure 4.
Effect of CV on DFE-induced increases in serum TARC and MDC levels in skin lesions. Levels of serum TARC (A, n = 7–8) and MDC (B, n = 7–8) were measured by ELISA. Data represent the mean values ± SEM (n = 7). Mean values with letters (a–c) within a graph are significantly different from each other at p < 0.05. TARC: thymus- and activation-regulated chemokine; MDC: macrophage-derived chemokine.

