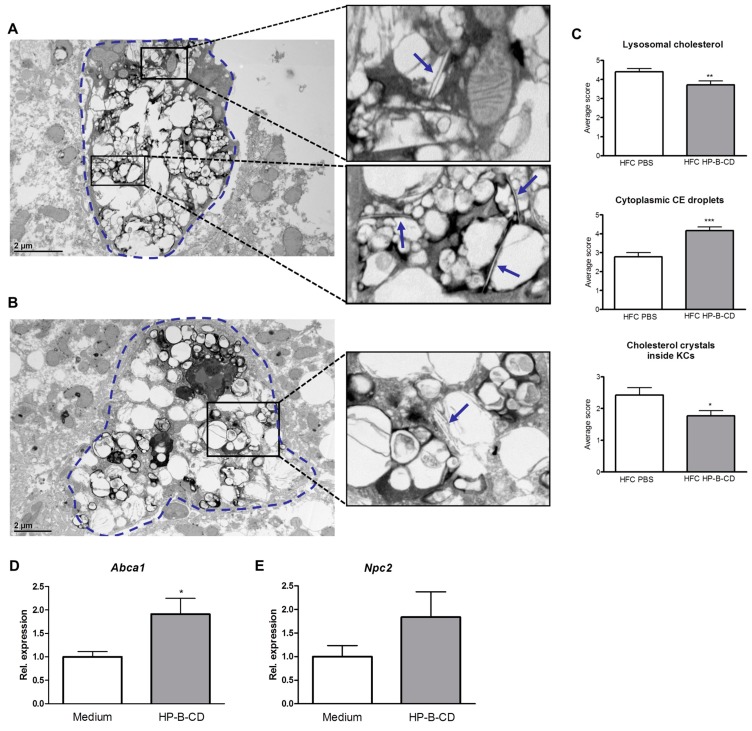
Figure 3.
Effect of HP-B-CD on intracellular cholesterol distribution and cholesterol transporters. Representative electron microscopy pictures of Kupffer cells (KCs) of HFC-fed Ldlr−/− mice without (A) and with HP-B-CD treatment (B). Lysosomes are indicated in black by ACPase staining. KCs are depicted by the dashed line. Arrows point to cholesterol crystals; (C) Scoring of lysosomal cholesterol, cytoplasmic cholesteryl ester (CE) droplets and cholesterol crystals after 12 weeks of HFC diet. In total, 40 to 50 KCs were scored per HFC group and an average score was calculated. Gene expression levels of the cholesterol transporters Abca1 (D) and Npc2 (E) in oxLDL-loaded BMDM with or without HP-B-CD treatment. The in vitro results are the mean ± SEM from two separate experiments performed in triplicate. * Significantly different from control. *, ** and *** indicate p < 0.05, 0.01 and 0.001, respectively.

