Figure 6.
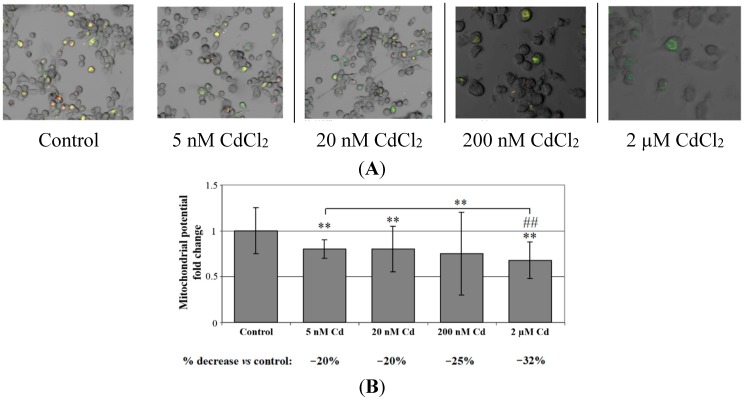
The effect of cadmium on mitochondrial potential (ΨΔm) in cells cultured with various cadmium chloride solutions. (A) Monocytes/macrophages were cultured with CdCl2 solutions for 48 h. After, cells were incubated with JC-1 probe for 30 min in the dark, at 37 °C. Control cells showed mainly an intense red-orange fluorescence coming from JC-1 aggregates. In contrast, some Cd-treated cells showed also green fluorescence coming from JC-1 monomers; (B) Quantitative measurements of the fluorescence intensity performed by plate reader, normalized to protein content and expressed as relative fold change to the mean value in the control group. The intensity of red-orange fluorescence in the Cd-treated cells was significantly lower with respect to control and in dose-dependent manner. Experiments were conducted as six separate assays (each assay in three replicates) with similar results, thus pictures are representative fields. **, statistically significant differences in comparison to control (p ≤ 0.005); ##, statistically significant differences in comparison to 5nM Cd (p ≤ 0.005). Control, cells incubated in RPMI 1640 medium with 10% FBS and with H2O as vehicle.

