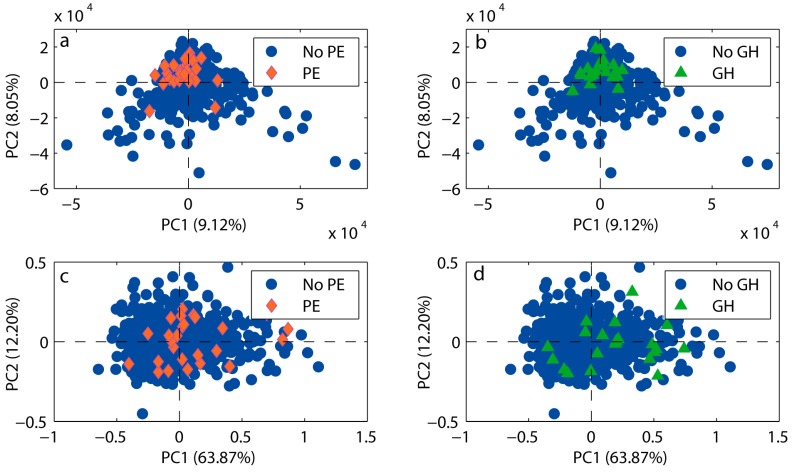
Figure 1.
Score plots from principal component analysis (PCA) of urine and serum spectra. PCA score plots of the first and second principal components (PCs) with the percent variance explained, performed on urine samples (a,b) and serum samples (c,d). Urine samples gave a clustering of women set to develop preeclampsia (PE) (red diamonds, n = 26) or gestational hypertension (GH) (green triangles, n = 21), while serum samples gave no apparent clustering. Samples from women without hypertensive disorders of pregnancy are shown in blue circles n = 552.

