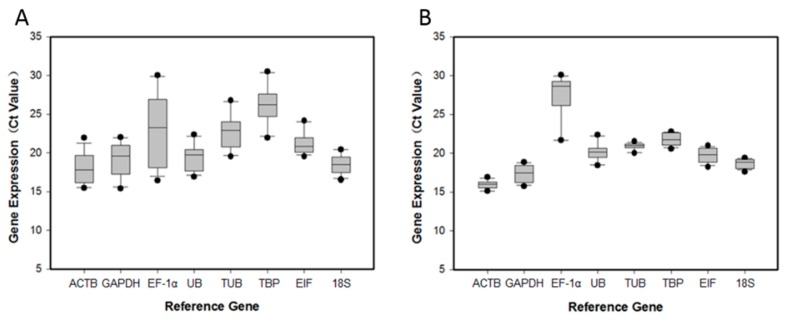
Figure 1.
Expression levels of candidate reference genes under different experimental conditions. The expression levels of candidate reference genes in eight different tissues (A) and six different ovarian developmental stages (B) are displayed as cycle threshold (Ct) values. The median is indicated by the line in the box. The interquartile range is bordered by the upper and lower edges, which indicate the 75th and 25th percentiles, respectively. The whiskers are inclusive of the maximal and minimal values, but exclusive of the outliers, which are represented by circles.

