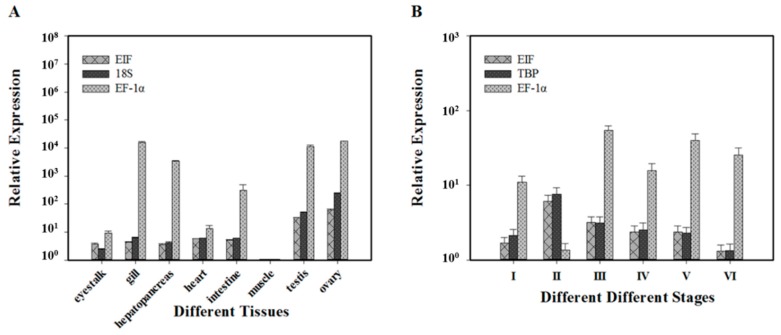
Figure 6.
Expression levels of Pcna using different candidate reference genes for normalization. (A) Pcna expression patterns in eight different tissues. Different bars indicate Vg expression levels normalized against EIF, 18S and EF-1α; (B) Pcna expression patterns in six different ovarian developmental stages. Different bars indicate Vg expression levels normalized against EIF, TBP and EF-1α. No developmental stage = I, early developmental stage = II, previtellogenic stage = III, vitellogenic stage = IV, mature stage = V, post-spawning stage = VI.

