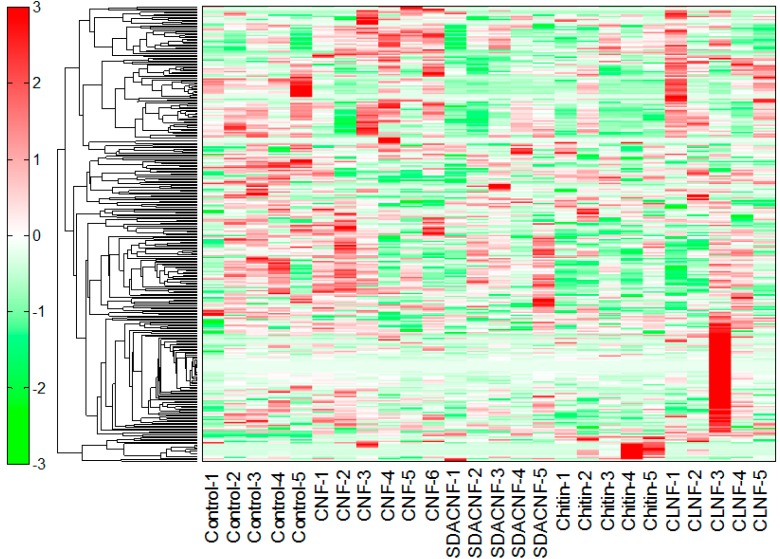
Figure 1.
Results of hierarchical cluster analysis of plasma metabolites. An ordinate and an abscissa indicate peaks and names of experimental groups, respectively. Hierarchical cluster analysis (HCA) was performed for peaks, and distance between peaks are shown as tree diagrams. Denser green and red indicate shorter and longer distances than those of the control group, respectively. CNF, chitin nanofiber; SDACNF, surface-deacetylated CNF; CLNF, cellulose nanofiber.

