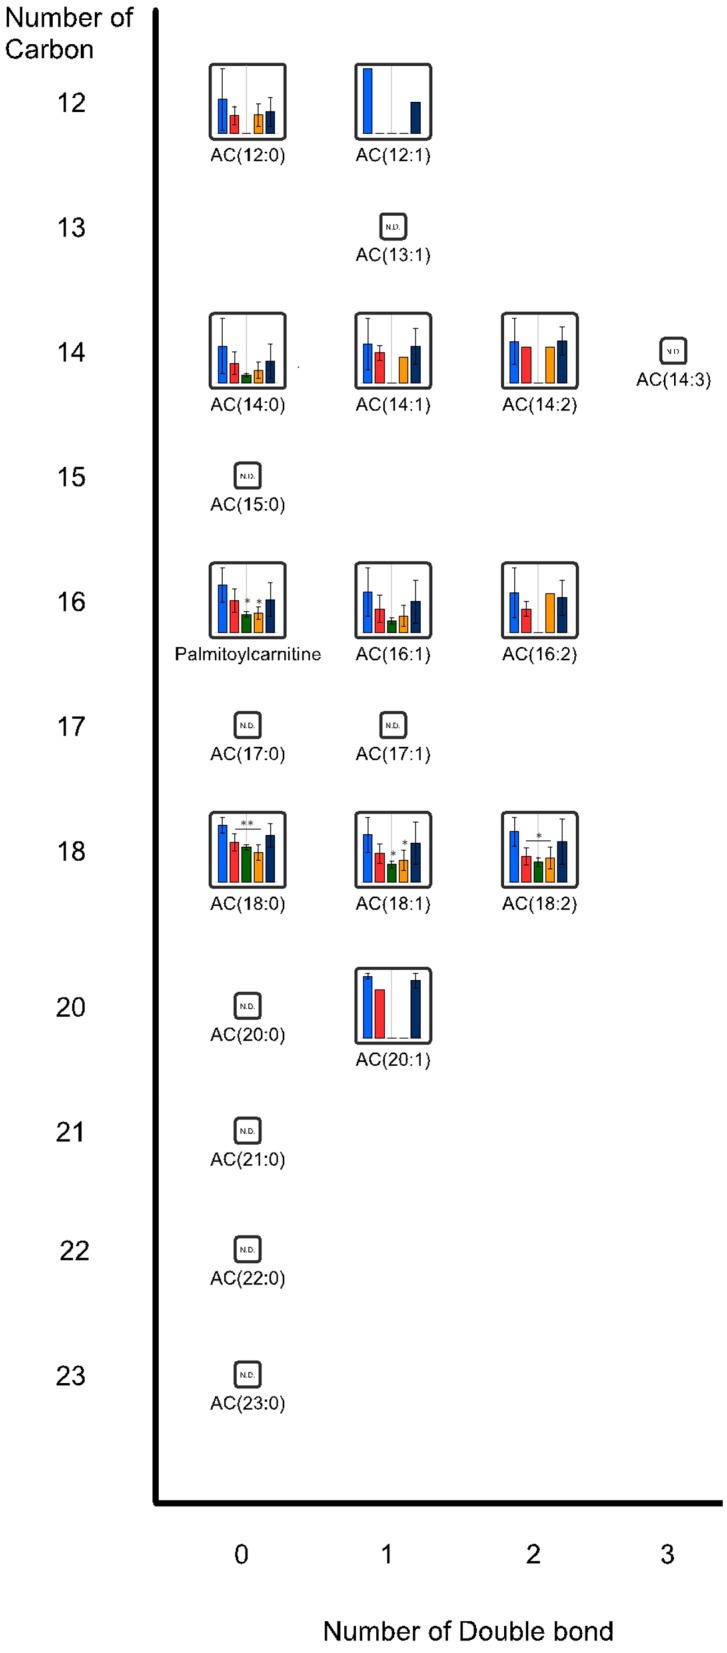
Figure 3.
Plasma acyl-carnitine (AC) levels. Each bar represents median ± standard deviation (SD) of metabolite in each group. * p < 0.05, ** p < 0.01 indicate significant differences in metabolite concentrations compared to the control group. All the p-values were determined using Welch’s t-test. (blue, control; red, chitin nanofibers (CNFs); green, surface-deacetylated (SDA) CNFs; orange, chitin; navy, cellulose nanofiber (CLNF); N.D.: not detected).

