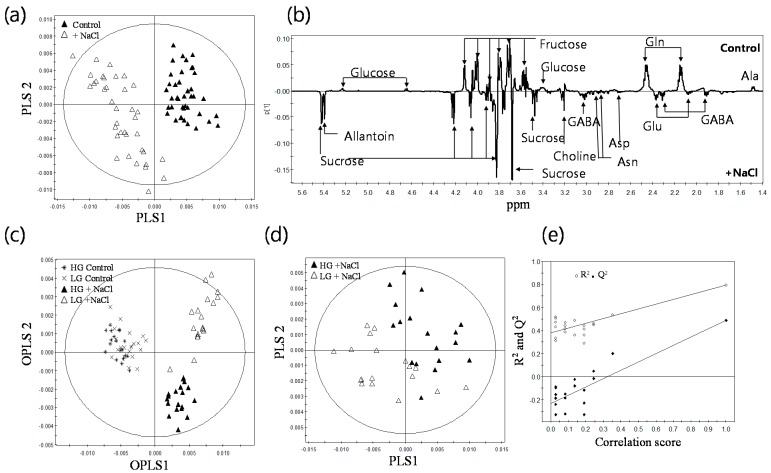
Figure 3.
Multivariate statistical analysis of 1H-NMR data depending on the growth type and salt response of rice roots. (a) PLS-DA score plot from total of 76 samples obtained from the control and 38 mild salt-treated genotypes; (b) PLS-DA loading plot of the control and salt-treated groups; (c) OPLS/O2PLS-DA score plot of four groups: HG control, LG control, HG + salt, LG + salt; (d) PLS-DA score plot to distinguish the differences between the salt-treated HG and LG groups; (e) The validation plot of permutation test for the PLS-DA of (d). The R2Y intercept is at 0.381 and the Q2Y intercept is at −0.218. The circles in the OPLS/O2PLS-DA and PLS-DA score plots indicate the tolerance ellipse based on Hotelling’s T2. The X-axis denotes correlation scores between original and permuted data.

