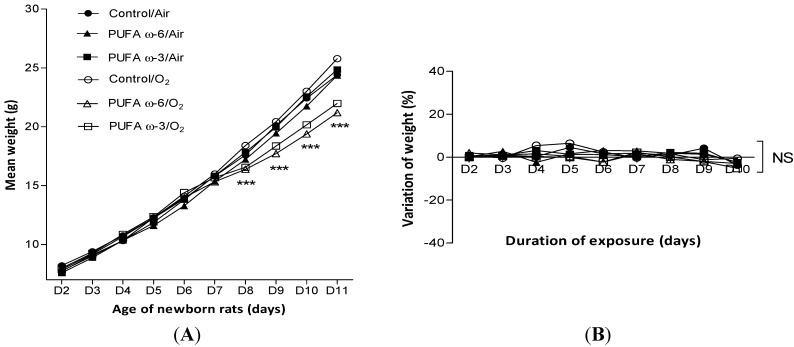
Figure 1.
Evolution of weight of newborn rats (A) and daily variation of weight of nursing adult rats (B) depending on exposure to hyperoxia and type of supplementation. Value are expressed as mean ± SEM (n = 30 in PUFA ω-6/air, PUFA ω-3/air, PUFA ω-6/O2 and PUFA ω-3/O2, and n = 10 in control/air and control/O2). *** p < 0.001 comparing PUFA ω-6/O2 to control/air and to PUFA ω-6/air and comparing PUFA ω-3/O2 to control/air and to PUFA ω-3/air (Figure 1A). NS: not significant.

