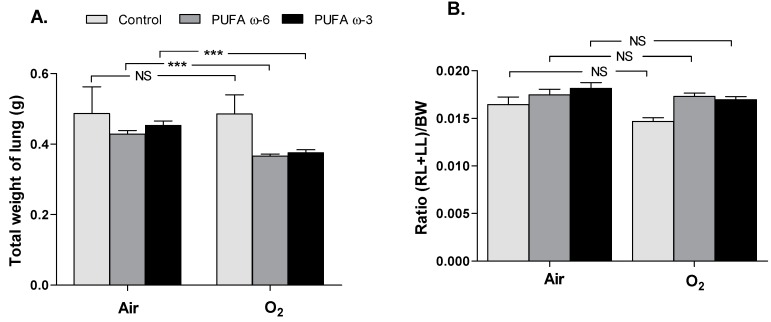
Figure 2.
Lung morphometry, comparing the weight of both lungs (A) expressed as the ratio right and left lungs /body weights (RL + LL)/BW (B) in newborn rats exposed to hyperoxia or not, and according to the type of supplementation. Values are expressed as mean ± SEM (n = 30 in PUFA ω-6/air, in PUFA ω-3/air, in PUFA ω-6/O2 and in PUFA ω-3/O2, and n = 10 in control/air and in control/O2). *** p < 0.001; NS: not significant. RL: right lung; LL: left lung; BW: body weight.

