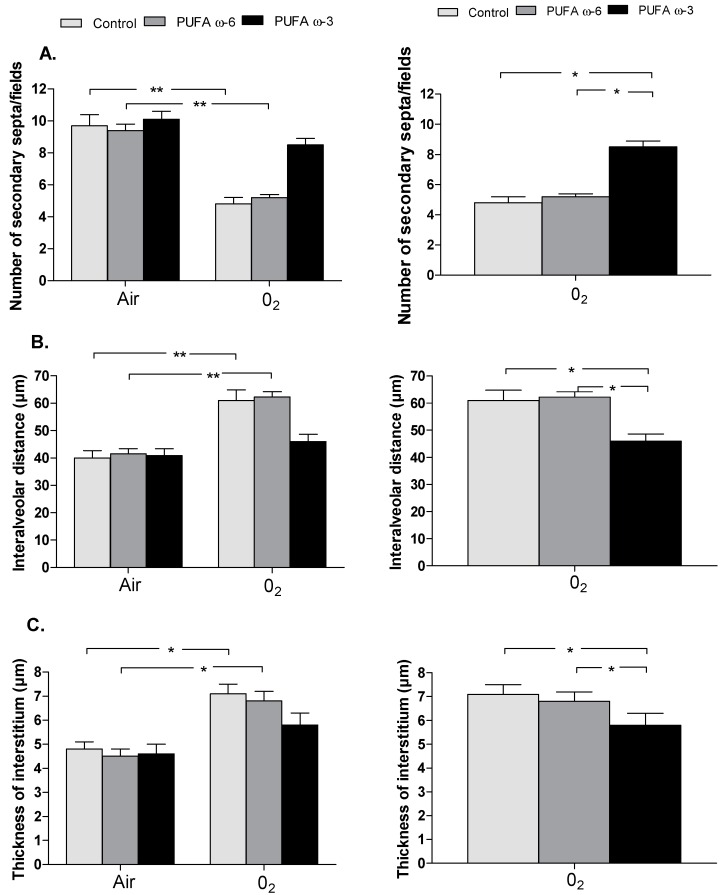
Figure 4.
Lung morphometry, including the number of secondary septa/fields (A); the interalveolar distance (B); and the thickness of the interstitium (C). Value are expressed as mean ± SEM (n = 30 in PUFA ω-6/air, PUFA ω-3/air, PUFA ω-6/O2 and PUFA ω-3/O2 and n = 10 in control/air and control/O2). SEM: standard error of the mean; ** p < 0.01 and * p < 0.05.

