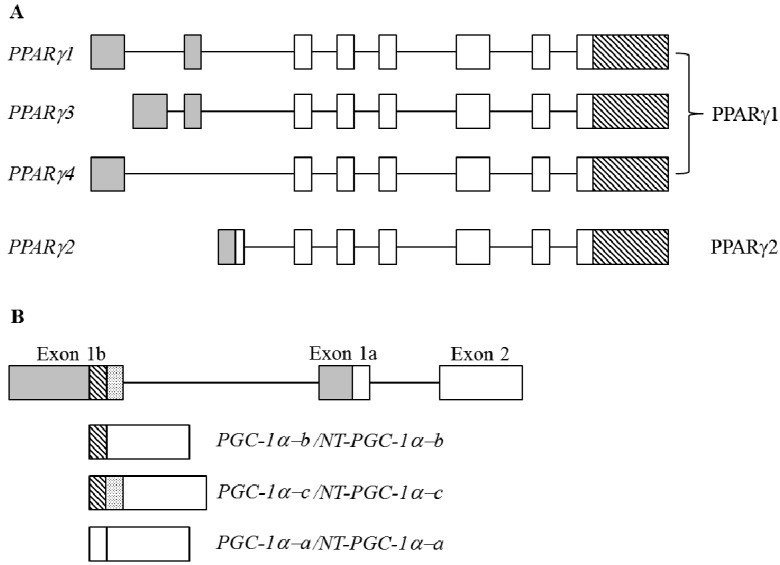
Figure 3.
(A) Schematic diagram represents the human PPARγ gene and alternatively spliced transcripts. The gray rectangles with different sizes represent the 5′ untranslated regions (UTRs), and the backslash rectangles represent the 3′ untranslated regions (UTRs). The open rectangles represent the coding exons; (B) Schematic diagram shows the composition of N-termini of murine PGC-1α gene. The gray, backslash and dotted rectangles represent the different 5′ untranslated regions (UTRs), and the open rectangles represent the coding exons.

