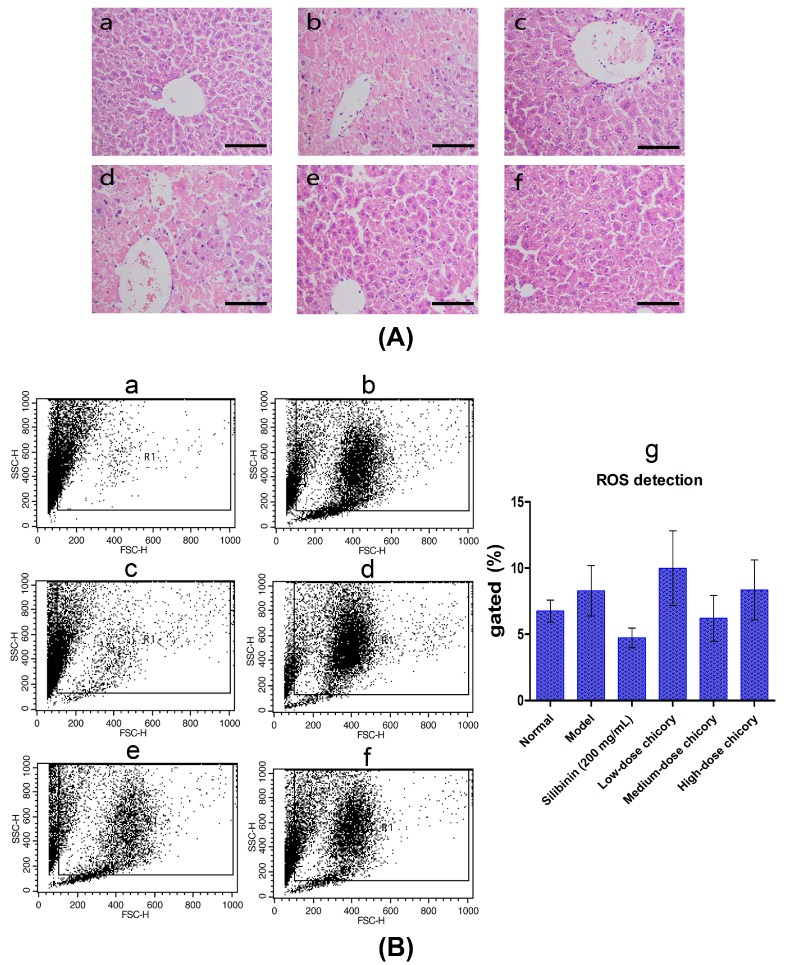
Figure 2.
(A) Liver tissue histopathological observation results, (a) normal control; (b) liver injury model; (c) positive drug silibinin control (200 mg/mL); (d) low-dose drug group (2.0 g/kg chicory); (e) middle-dose group (6.0 g/kg chicory); and (f) high-dose group (18.0 g/kg chicory); and scale bar = 100 μm; (B) ROS detection result, (a) normal control; (b) liver injury model; (c) positive drug silibinin control (200 mg/mL); (d) low-dose drug group (2.0 g/kg chicory); (e) middle-dose group (6.0 g/kg chicory); (f) high-dose group (18.0 g/kg chicory); and (g) quantitative analysis of ROS detection. FSC-H and SSC-H represent cell numbers and fluorescence intensity, respectively.

