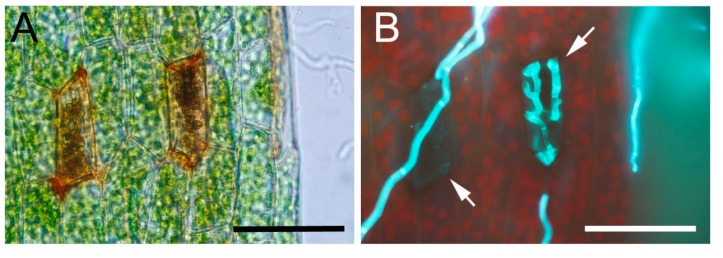
Figure 3.
Cell wall-associated defenses in C. gloeosporioides-infected tissues. (A) C. gloeosporioides-infected cells showing brown cell walls at 2 DAI; (B) Same leaf as A stained with solophenyl, hyphae inside the cells are indicated with a white arrow; (C) Control leaf; (D) C. gloeosporioides-infected leaf stained with safranine-O at 2 DAI; (E) Same leaf as D stained with solophenyl. Scale bars represent 50 μm.


