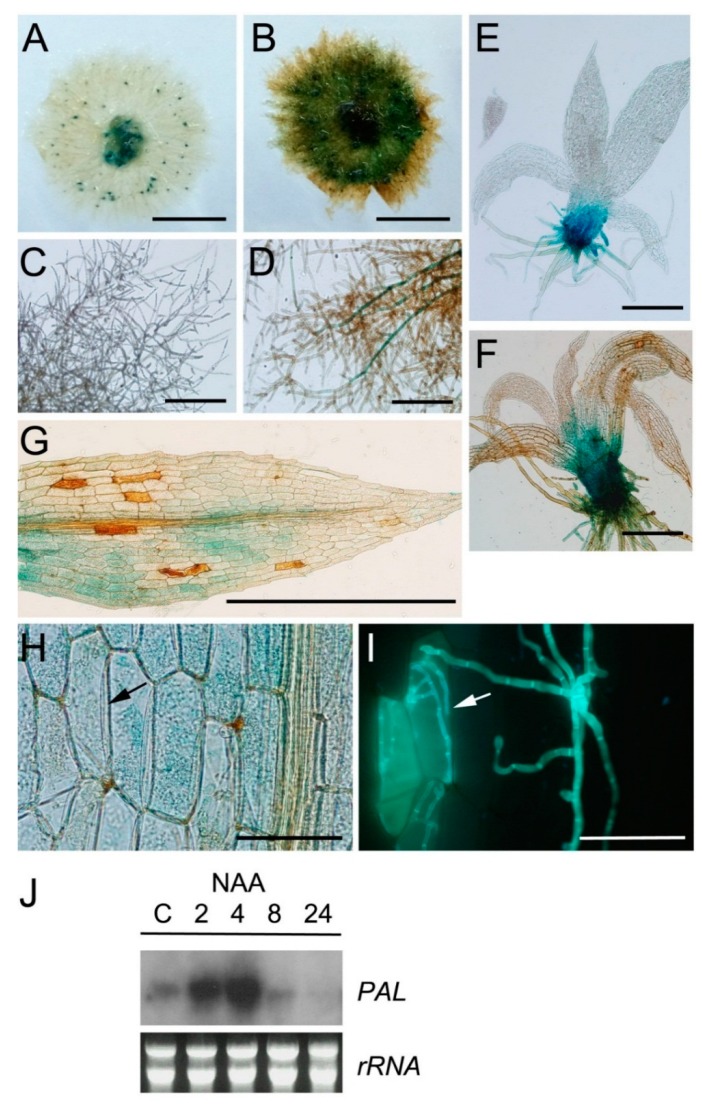
Figure 6.
Auxin signaling is activated in P. patens after C. gloeosporioides inoculation. GUS staining of GH3::GUS reporter line in: (A) Untreated colony; (B) C. gloeosporioides-inoculated colony; (C) Untreated protonema; (D) C. gloeosporioides-inoculated protonema; (E) Untreated gametophore; (F) C. gloeosporioides-inoculated gametophore; (G) C. gloeosporioides-infected leaf; (H) C. gloeosporioides-infected leaf; (I) Same leaf as H stained with solophenyl. The black arrow in H and the white arrow in I indicate C. gloeosporioides-infected cells. All pictures of C. gloeosporioides inoculated tissues were taken at 2 DAI; (J) Expression of PAL after NAA treatment. Moss samples were harvested at the indicated times (hours) after treatment. Scale bars represent 0.5 cm in A and B; 0.5 mm in C–G and 50 μm in H and I.

