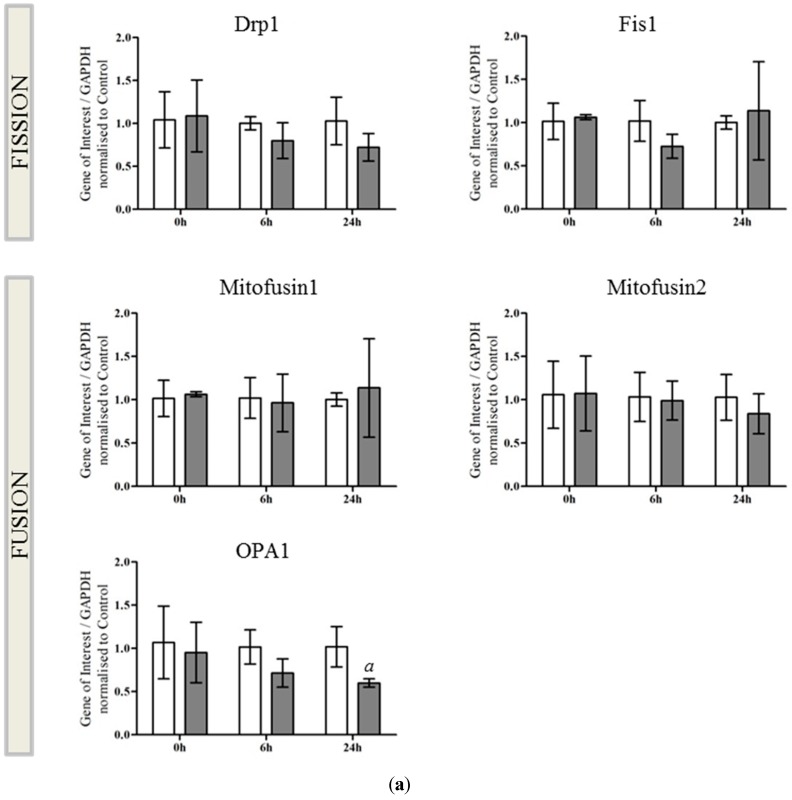
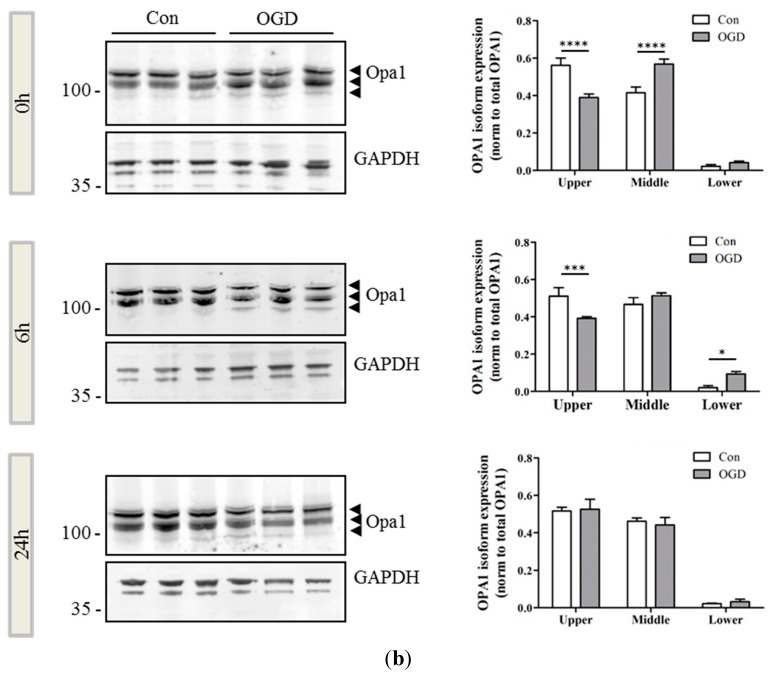
Figure 2.
OPA1 processing is altered after OGD (a) mRNA generated from control (white bars) and OGD-treated (grey bars) primary neurons was analyzed by qRT-PCR for changes in expression of fission (Drp1, Fis1) and fusion genes (Mitofusin 1 and 2, OPA1). There was a small but significant decrease in OPA1 expression in response to OGD exposure (a = 0.0296). Mean data shown ± SD (n = 4–5 independent litters), significance determined by two way ANOVA; (b) Protein lysates were generated from primary neurons either immediately after 90 min OGD (0 h) or following 6 or 24 h recovery. Proteins were resolved by SDS-PAGE and OPA1 analyzed by western blot. Equal protein loading was determined by GAPDH expression. Size distribution of the OPA1 immunoreactivity is expressed as a proportion of total OPA1 (arrowheads). There was a significant increase in the expression of the OPA1 lower band at 0 and 6 h, significance determined by two-way ANOVA for treatment and band. If there was a significant interaction, a Bonferroni post-hoc was performed. Data are mean ± SD (n = 3 independent litters), * p < 0.05, *** p < 0.001, **** p < 0.0001.


