Figure 3.
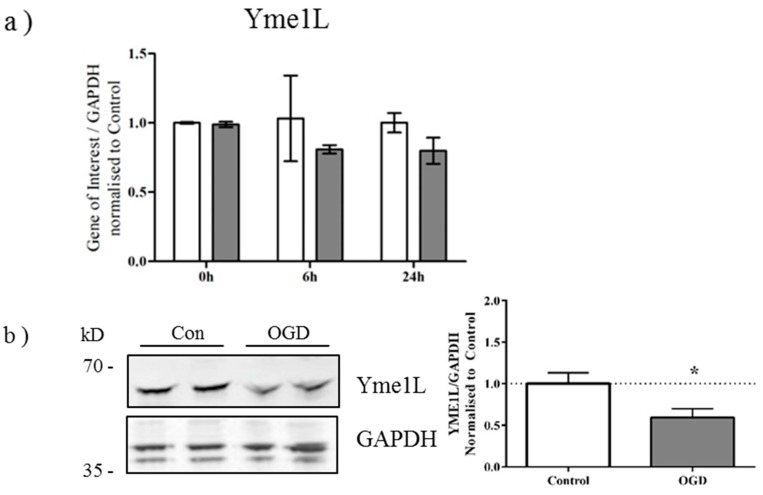
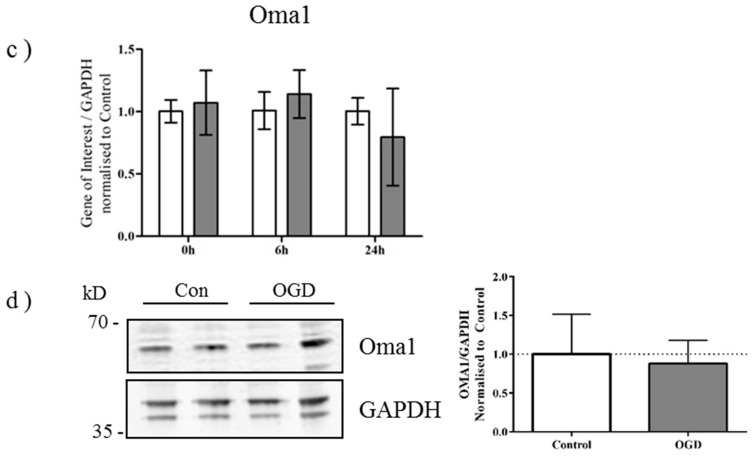
Yme1L protein expression is reduced after OGD (a) mRNA generated from control and OGD-treated primary neurons was analyzed by qRT-PCR for changes in expression of Yme1L. Data shown ± SD, n = 3–4 independent litters; (b) Protein lysates were generated from primary neurons immediately following OGD and analyzed by western blot for expression of Yme1L. Equal protein loading was determined by GAPDH expression which was used for the quantification (right hand panel). Figure is representative of three individual litters, * p < 0.05 determined by students t-test; (c) Oma1 gene expression or (d) Oma1 protein expression was determined as above with GAPDH for equal loading. Data was analyzed as above. Figure is representative of three individual litters.


