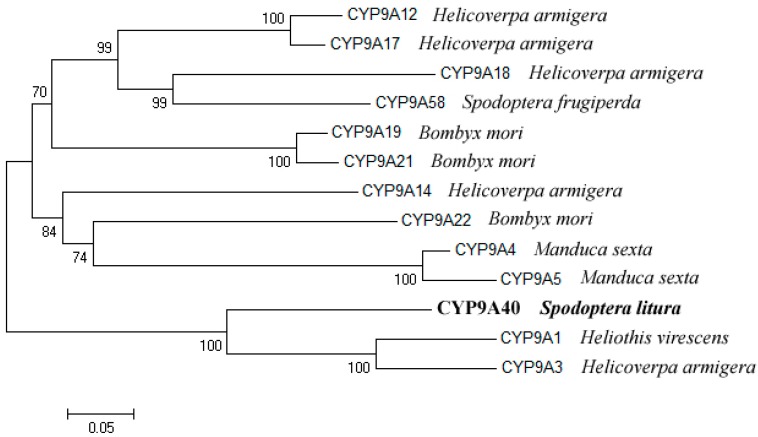
Figure 2.
Phylogenetic analysis of CYP9A40 of S. litura and related P450s from various insects. The phylogenetic tree was constructed from generated alignments using the neighbor-joining (NJ) method of the Mega 4.0 software (MEGA, Tempe, AZ, USA). The values on the branches indicate the percentage frequencies at which the phylogram topology was representative for 1000 bootstrap replicates. The scale bar indicates 0.05 amino acid substitutions per site.

