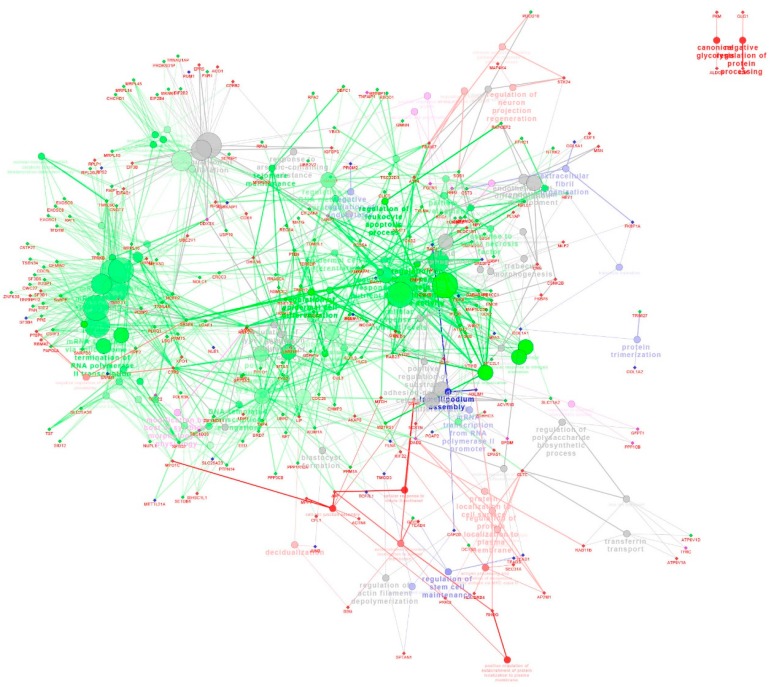
Figure 7.
The network of the DEGs unique to Yorkshire endometrium on gestational days 15, 26 and 50. The genes are represented as circles. Biological processes are represented as diamonds. The lines represent the potential regulation relationships between genes or connections between different genes belonging to different biological process. Red nodes represent genes that have intensive expression on gestational day 26 and 50. Blue nodes represent genes that have intensive expression on gestational day 26. Green nodes represent genes that have intensive expression on gestational day 15. Purple nodes represent genes that have intensive expression on gestational day 50.

