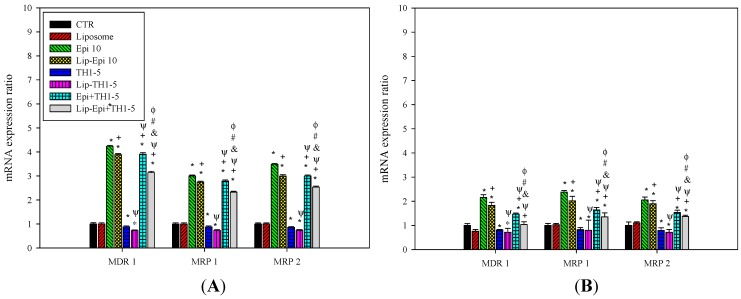
Figure 5.
The effect of different treatments on the expression ratio of the MDR pump-related genes including MDR1, MRP1, and MRP2 in (A) SCC15 and (B) NT2D1 cells. Each experiment was conducted in triplicate. * p < 0.05 compared to CTR; + p < 0.05 compared to Epi; Ψ p < 0.05 compared to TH1-5; # p < 0.05 compared to Epi+TH1-5; & p < 0.05 compared to Lip-Epi; Φ p < 0.05 compared with Lip-TH1-5.

