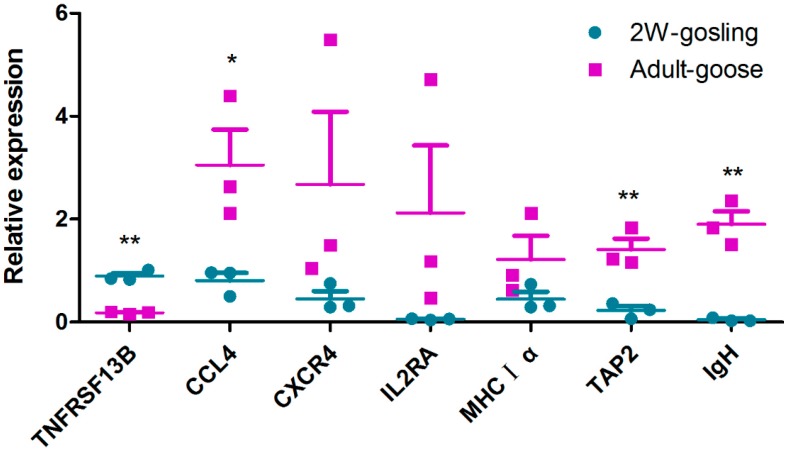
Figure 9.
Validation of the gene expression profile by qRT-PCR. Each dot represents an individual goose in one of the two groups (one group is two-week-old goslings; the other group is adult geese). The mRNA level of each spleen sample was quantified by qRT-PCR in triplicate for each gene. GAPDH was amplified as an internal control. The chart was constructed in GraphPad Prism 5. The relative expression levels were compared using multiple t-tests. Data are represented as the mean ± SEM (n = 3). For gene symbols representing different genes, refer to Table 4. * indicates significant differences (p ≤ 0.05), ** indicates extremely significant differences (p ≤ 0.01).

