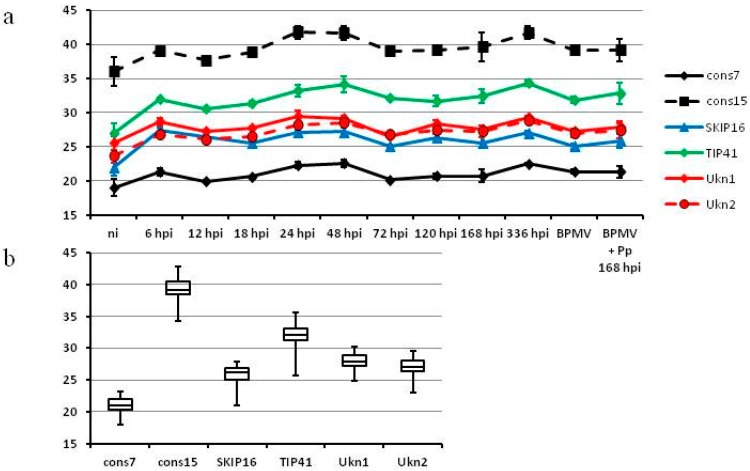
Figure 3.
Variation of Cq values for G. max candidate reference genes between samples (vertical axis: Cq). (a) Average and standard deviation of Cq values for every sample; (b) box plots representing the range of Cq values; For better representation of RNA abundance the Cq values were corrected for primer efficiency: Cqcorr = lg2 ((2 × e)Cq).

