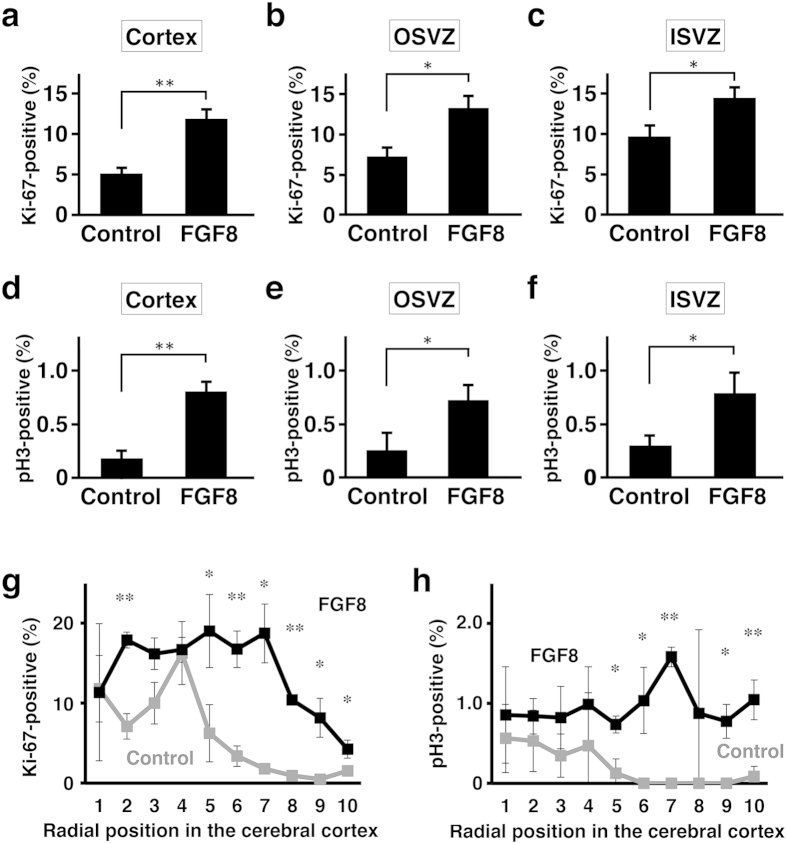
Figure 5. Quantification of cell proliferation in TD ferrets.
GFP and FGF8 were expressed in the ferret cerebral cortex at E33 using in utero electroporation, and the brain was prepared at P6. Coronal sections containing the anterior part of the lateral ventricle were used for quantification. The numbers of Ki-67-positive cells (a–c,g) and pH3-positive cells (d–f,h) were counted, and were divided by the numbers of Hoechst 33342-positive cells in the same regions. The percentages of positive cells in the cerebral cortex (a,d), the OSVZ (b,e) and the ISVZ (c,f) are shown. (g,h) The cortex was divided into 10 regions along the radial axis from the ventricular surface (1) to the pial surface (10). The numbers of Ki-67- and pH3-positive cells in each region were counted and were divided by the numbers of Hoechst 33342-positive cells in the same region. The percentages of positive cells are shown. Bars represent mean ± SD. *p < 0.05; **p < 0.01. n = 3 for each condition.

