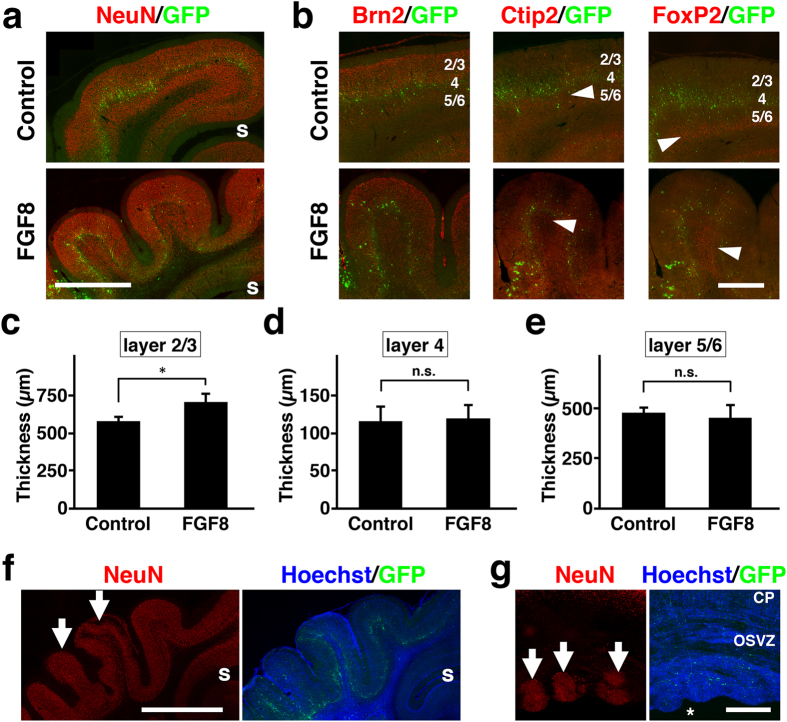
Figure 8. Layer structures in the cerebral cortex of TD ferrets.
GFP and FGF8 were expressed in the ferret cerebral cortex at E33 using in utero electroporation, and the brain was prepared at P6 (g) and P36 (a–f). Using coronal sections, immunostaining (red) and Hoechst 33342 staining (blue) were performed. GFP-positive transfected cells are shown in green. (a) NeuN immunostaining. Lower magnification images of the cerebral cortex of control ferrets and polymicrogyria of TD ferrets are shown. s, splenial sulcus. (b) Higher magnification images of polymicrogyria with normal layer structures. Layer-specific expression patterns of Brn2, Ctip2 and FoxP2 were preserved in the cortical area with polymicrogyria. Arrowheads indicate immunopositive cells. Numbers indicate layers in the cortex. (c–e) The average thicknesses of layer 2/3 (c), layer 4 (d) and layer 5/6 (e). Note that layer 2/3 was significantly thicker in TD ferrets than in control ferrets. Bars represent mean ± SD. *p < 0.05; n.s., not significant. (f) Lower magnification images of polymicrogyria with distorted layer structures. Layer 2/3 neurons were predominantly increased (arrows). s, splenial sulcus. (g) Subependymal heterotopia (arrows). CP, cortical plate; OSVZ, outer subventricular zone. Asterisk indicates the lateral ventricle. Scale bars = 2 mm (a), 1 mm (b), 3 mm (f) and 500 μm (g).

