Figure 2 (See previous page).
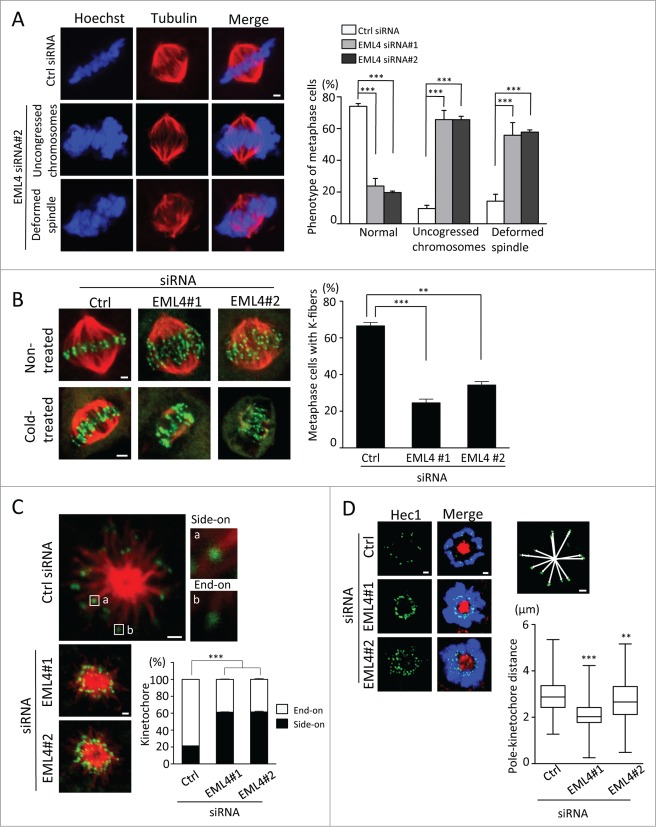
EML4 knockdown disrupts spindle organization and kinetochore-microtubule attachment. (A) siRNA-transfected cells were fixed and immunostained with anti-α-tubulin antibody and Hoechst. Representative images are shown (Scale bar = 1 μm). The graph indicates the percentage of metaphase cells with the indicated phenotype. Three independent experiments were performed, and more than 300 cells in total were evaluated (mean ± SEM, ***P < 0.01). (B) siRNA-transfected cells were non-treated or cold-treated and then immunostained with anti-α-tubulin and anti-CREST antibodies. Representative images are shown (Scale bar = 1 μm). The graph indicates the percentage of cold-treated cells with stable k-fibers. Three independent experiments were performed, and more than 150 cells in total were evaluated (mean ± SEM, ***P < 0.01). (C) siRNA-transfected cells were treated with monastrol and then immunostained with anti-α-tubulin and anti-CREST antibodies (Scale bar = 1 μm). The graph indicates the percentage of side-on and end-on attached kinetochores. Three independent experiments were performed, and approximately 1,000 kinetochores from 50 cells were evaluated (mean ± SEM, ***P < 0.01). (D) siRNA-transfected cells were treated with monastrol and immunostained with anti-Hec1 and anti-α-tubulin antibodies and Hoechst (Scale bar = 1 μm). Representative images are shown. The image above the graph shows how the distance from the pole to each kinetochore was measured. The graph shows the average distance of the pole to each kinetochore. Horizontal lines in the boxes indicate medians and the boxes extend from 25th to 75th percentiles. Three independent experiments were performed, and more than 600 kinetochores from 40 cells were evaluated using Image J software (***P < 0.01, **P < 0.05).

