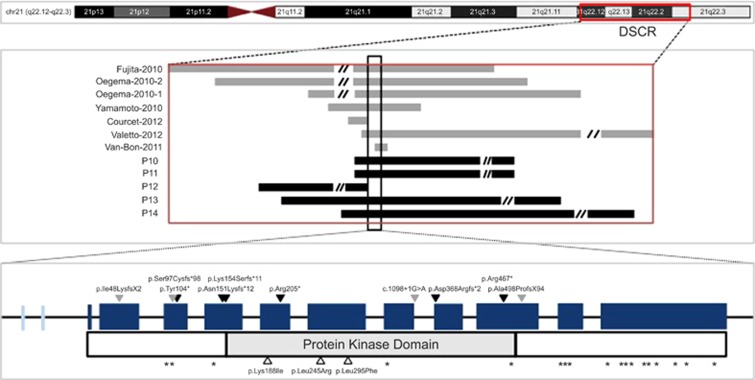
Figure 3.
Schematic representation of all genetic alterations in this report and those previously reported in the literature. Upper panel: chromosome 21 cytoband (hg19); boxed area represents DSCR. Middle panel: 21q22.13 deletion in different patients (un-scaled illustration); gray: published microdeletions, as indicated by the author and year; black: five microdeletions including DYRK1A. The black box across the deletions shows the position of DYRK1A gene. Lower panel: DYRK1A single-nucleotide variants and small INDELs with the scheme of corresponding amino-acid changes; blue box: the 11 exons of the DYRK1A gene. The width of the box represents the number of nuclear acids; light blue box: two alternative splicing sites; black solid arrowheads: Nonsense or frameshift variants identified in our patients; gray solid arrowheads: nonsense or frameshift variants identified in cases from published literature; white arrowheads: missense variants identified in our patients; (*)asterisks: missense variant positions in normal individuals in EVS that are predicted to be damaging by PolyPhen2.

