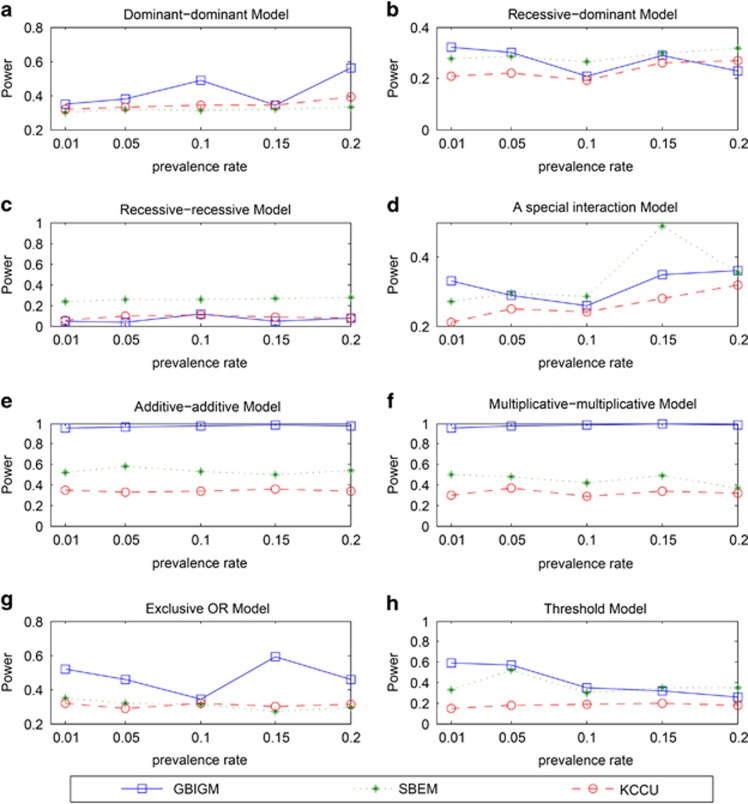
Figure 3.
The power comparison among three different GGIs detecting methods under different disease models and different prevalence rates. The horizontal axis is the prevalence rate ranging in 0.01 to 0.2 and the vertical axis is the power obtained from the three methods. There are 8 different disease models from a to h.

