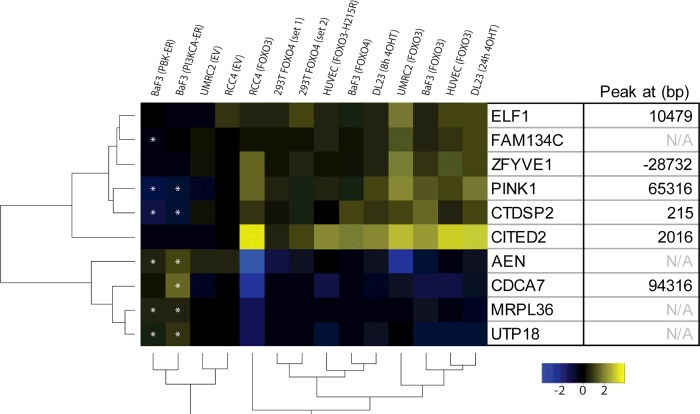
Figure 1. A common set of FOXO-regulated genes in human and mouse cell lines overexpressing FOXO3 or FOXO4.
FOXO3 and FOXO4 induced changes in HUVECs and UMRC2, RCC4, BaF3, DLD1-derived DL23 [19] and HEK-293T cells were compared. Depicted are genes statistically significantly (P<0.05) regulated in relevant datasets (see the Materials and methods section for details). Asterisks indicate genes that are statistically significantly (ANOVA, P<0.05) regulated by PI3K or PKB/Akt activation, in opposing direction compared with FOXO3/4 activation. The right-hand side shows the distance of the closest FOXO3 peak in DL23 cells deduced from [27].

